Putting the trace before the loop
An observability-first approach for building an AI agent, and what it bought me.
A couple of weeks ago I started implementing Kept, a self-hostable post-purchase support agent for e-commerce, with reliability as its core offering. Besides the product itself, my objective in building it is to delve into the depths of agentic system design, and see what it actually means to build an agent with "reliability at its core".
Observability first
I started from a theory my experience validated again and again throughout the years: observability is the bedrock of reliability. Proper logs and metrics beat an ideal architecture, industry-leading frameworks or best coding patterns.
That was the case well before the agentic era, and I've always paid particular attention to this layer. But with the advent of non-deterministic LLMs sitting at the core of products, I decided to take that to the next level: designing and implementing the full tracing layer before writing a single line of code for the main agent loop/product. Turned out to be an insightful experience.
Up next I'll walk through how I designed and implemented the tracing layer, then present 3 benefits and 2 drawbacks that I consider worth highlighting from the observability-first approach, and end with some thoughts on how to apply the approach if you don't have the luxury of starting with a fresh codebase.
Tracing layer design and implementation
I started with an AI-assisted research phase. Here's a list of resources I found particularly useful:
- Anthropic, "Building Effective Agents"
- OTel blog, "Inside the LLM Call: GenAI Observability with OpenTelemetry"
- John Hodge, "OpenTelemetry GenAI semantic conventions"
- OTel GenAI semantic conventions, the dedicated repo
- Langfuse data model
0. The guiding design decision
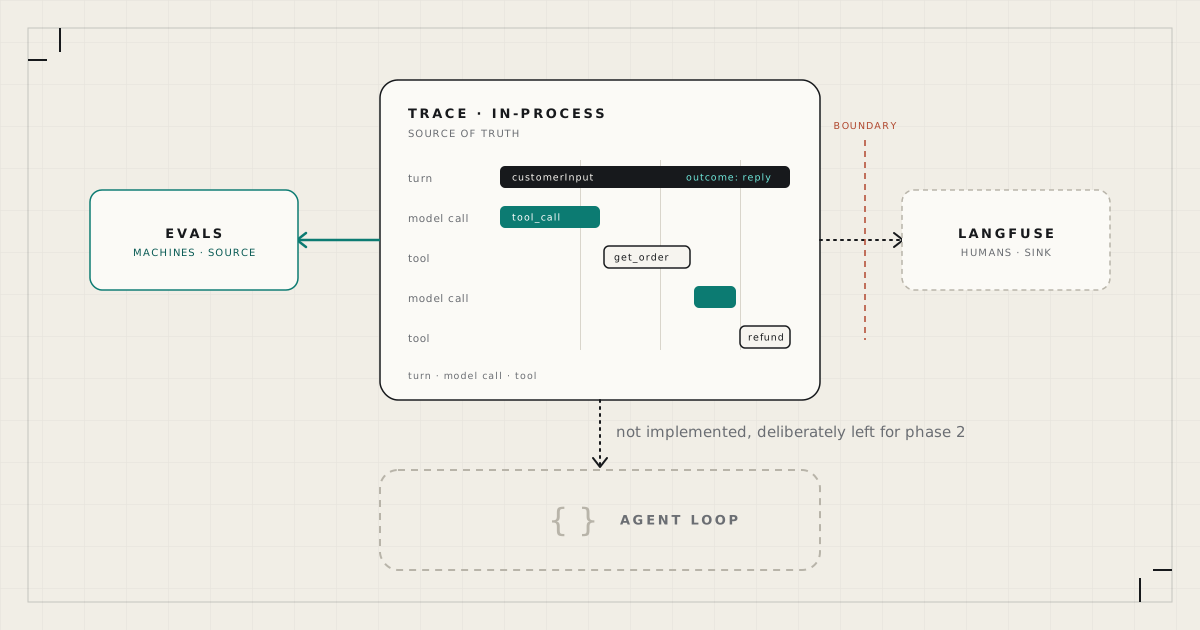
The research produced the first important insight. My original idea was to have Langfuse as the source of truth that saves all spans and traces and serves them wherever they're needed. But then I realized I'd have two consumers with very different needs. First we have the human, who needs to analyze, search and filter the traces in a well-structured UI. Then we have the machine (mostly evals) that needs fast access to a reliable record of what happened. Langfuse was the right choice for the human side, but having evals rely on it to get their traces meant additional API calls that added cost and latency, plus complex concurrency scenarios that needed to be accounted for.
So I defined the first design decision in ADR-0001, which states that Langfuse is a sink for humans, not a source for machines. The practical consequence was an in-process model of the trace as the source of truth (which evals could use to run their checks), and Langfuse as a projection of it. This meant no Langfuse SDK and no OTel SDK in the core package, with a boundary-check script (check-eval-boundary.mjs) that enforced the ADR.
The rest of the design/implementation process looked like this:
1. Deciding the shape of the span tree
I started sketching the shape of the span tree, using a self-test that drove every sketch round: can the types express "a model call inside turn 2 followed by a tool span whose result state was unknown"?
After multiple rounds of sketches, I went from "every model call is a span" to three span kinds with a parent link: turn, model call, tool execution. The turn span would be the parent, and model calls would sit as siblings to tool executions, with causality carried by a callId. This move also enabled a three-layer taxonomy:
| Layer | Where it lives | Fields |
|---|---|---|
| What the customer saw | The turn span (types.ts#L84-L87) | customerInput at start, outcome at end. The outcome is a union: reply with message text, failed with a reason, conversation full. |
| What the model saw | The model-call span (types.ts#L27-L39) | inputMessages at start, outputMessages at end. The assembled prompt, the model's reply including any tool-call requests, and tool responses as presented back to it. |
| What actually happened | The tool-execution span (types.ts#L48-L54) | toolName, callId, args at start. resultState and result at end. The args really executed and the state really returned. |
2. Choosing the stamps by consumer
The next task was deciding what gets stamped on every trace and span (types.ts#L129-L144). Guided by the OTel GenAI semantic conventions, I picked the stamps by asking who reads each one later. A few examples:
promptHashfor evals, hashing the template rather than the rendered prompt so the hash means "prompt version";backendKindto localize a failure to adapter or core;traceIdkept distinct fromsessionId, so evals can replay a conversation without merging the traces into one garbled tree;- a
faultTogglesarray in preparation for a later CI matrix: every trace declares which faults were injected when it ran, so a red in the matrix can be attributed to the toggle that caused it.
3. Lifecycle and end states
A span starts as in_progress while its corresponding process is running, and when the process finishes, it can end either in a completed or error state. If the span is still in_progress when a trace is ended (trace.ts#L82-L91), it's marked as undetermined (span.ts#L92-L105), so a crash mid-span surfaces as a span rather than a missing one. undetermined is deliberately not error, because the step never reported failure, and not absent, because absence is indistinguishable from never started.
Within the model-call span, there can be multiple tool_call_response messages, each with its own status ('ok' | 'failed' | 'unknown'), which is kept distinct from the span status. This way, the span status describes the step, while the tool result state describes the tool's answer, so a tool that cleanly reports failure is a completed span.
A few more notes on the span lifecycle:
- for each span, first completion wins. A
completedspan can't be later changed toundetermined; - trace end is idempotent and cached;
- starting a span after end (trace.ts#L34-L43) is an error, thrown in dev and dropped in prod (trace.test.ts#L135-L144);
- using the wall clock to mark the span start and a monotonic mark for duration.
4. Interfaces
Up next was writing the types according to the conceptual design. Here's where I defined the shapes of the ModelCallPayload, ToolExecutionPayload and TurnPayload as well as the actual TracePayload. And I also defined the Message type and the discriminated union of MessageParts it can contain ('text', 'tool_call' or 'tool_call_response'); these types ended up hoisted outside the tracing module since they represent a core part of the domain. More on that in the next article.
You can view the types and their annotations in these files: types.ts, messages.ts.
5. Classes
This step was mostly about the design surviving the compiler. I implemented the spans as a generic, abstract SpanBase class with its end(), error() and abandonIfInProgress() methods corresponding to the end states I mentioned in the lifecycle design, plus some helpers. Then came the Trace class that was responsible for starting the spans, keeping them in a spans array and sweeping the unfinished ones in trace.end().
A noteworthy implementation detail was deriving Start... and End... payloads that corresponded to a span's constructor payload and its end() method, respectively. This was particularly useful to make the TypeScript compiler a friend and not a foe: the partition rule (types.ts#L12-L15), the model-call partition (types.ts#L41-L46), the generic base whose constraint is the invariant (span.ts#L36-L41), and the subclass where it is enforced (span.ts#L108-L112).
6. Trace exporter as four pieces
By this point, I had the first part of ADR-0001 done: the in-process model of the trace, ready to be used by evals and testing harnesses. What was left was the exporter that packaged the in-process/in-memory model and sent it over to Langfuse. I implemented it in four parts:
- a map holding the OTel GenAI attributes (otel-attributes.ts) I picked for the traces and spans (for example,
sessionIdas'gen_ai.conversation.id') - an OTLP mapper (otlp.ts#L245-L270) that maps the captured attributes from their internal implementation (
modelCallSpan.model) to the corresponding OTel GenAI semantic-convention name ('gen_ai.request.model'), and wraps them into an OTLP envelope to be sent over the network - a generic interface for the exporter (exporter.ts#L3-L21) that contained:
- an
export(input: CompletedTrace)function that takes a completed trace, uses the mapper to turn it into an OTLP envelope and fires the transport call, saving the promise forflush() - a
flush()function that awaits all pending exports
- an
- the Langfuse implementation of the generic interface (langfuse.ts#L50-L101). The export layer is the only place where we use Langfuse-specific lexicon, spread across the attribute map, the OTLP mapper and the transport itself. Since I already had the attributes following the OTel GenAI convention, I decided to send them to Langfuse via a simple
POSTrequest, skipping any extra dependencies
7. Verifying with a fabricated conversation
Since no agent existed at this point, I had to implement a script (trace-demo.ts) that created a fake WISMO ("where is my order") turn so I could see it in the Langfuse dashboard. I also left a span deliberately open (trace-demo.ts#L108-L117), so I could watch the trace sweep in action.
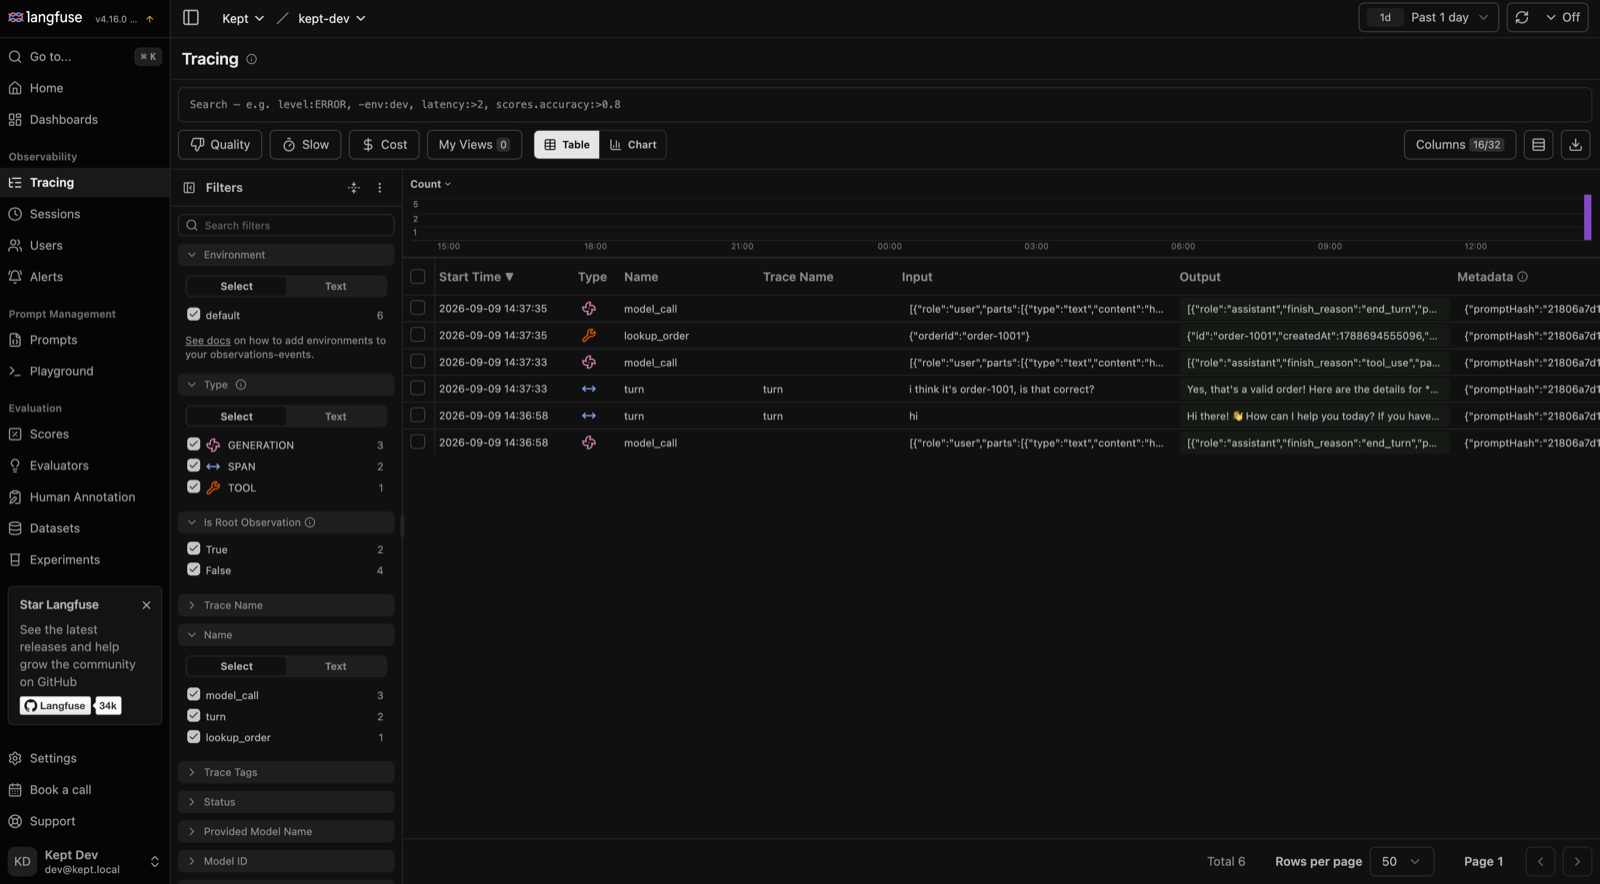
At this point I discovered a bug that actually made me happy: Langfuse was rendering "empty object" as a tool call argument, while args was populated in the in-process trace. While the fix (otlp.ts#L101-L125) was pretty simple (the attribute mapping was incorrect), this bug proved the utility of ADR-0001 defined at step 0. Had evals been reading Langfuse, an assertion like "the tool was called with order 1042" would have gone red, looking exactly like a policy bug, when the only defect was a key name in the mapper. Because evals were designed to read the in-process object, that class of failure cannot produce a false red.
With the clear split between the sources, I could implement tests that touched the core functionality of the agent, and handle transport/presentational errors separately (those still need to be tested, of course).
After a few more fixes and design updates, the tracing layer was done and I was ready to implement the main agent loop. More on that in the next article.
Tradeoffs
As I said in the beginning, designing the full observability layer before writing a single line of product code was a novel approach for me. The process ended up taking more time than I expected, but it was quite insightful. Here are a few benefits and drawbacks of the approach that I find valuable.
Benefit #1: you ask the production questions on day one
The first benefit of this approach was having to visualize the entire user-system-model-tools interaction from the perspective of the dashboard I'll stare at when debugging the ugliest bugs.
I had to ask myself questions that would normally come up only when the product misbehaved in production:
- what logs would be helpful when trying to understand what the model did?
- how would I search these logs?
- what attributes would I filter by?
- how would I know what state a conversation is in, and how it got there?
Besides the basic questions, edge cases came up, too. And thinking about them from the perspective of how I'll debug them was particularly useful:
- a tool span never completes, but the trace reaches its end. What does the trace show?
- that question is where the undetermined state in step 3 came from: in production, the unfinished span stays in the tree with a state that says "nobody knows". In development, it throws so I can fix the lifecycle bug.
- the eval runner replays the same conversation three times. What do I see?
- one garbled tree, if the trace id doubles as the conversation id, because any OTel backend merges every span that shares a trace id. That is the reason step 2 keeps
traceIddistinct from the session id: the recorder mints a fresh trace id per run, while the session id stays a correlation key owned by the outside world, so three replays render as three traces inside one session.
- one garbled tree, if the trace id doubles as the conversation id, because any OTel backend merges every span that shares a trace id. That is the reason step 2 keeps
- a policy check changes the args between what the model requested and what got executed. Which one does the trace record?
- both, in different places: the model's request stays in the model-call span's
outputMessages, while the args that actually ran go on the tool-execution span. That's exactly the purpose of the three-layer split from the step 1 table. The layers are allowed to disagree by design.
- both, in different places: the model's request stays in the model-call span's
Benefit #2: no existing constraints means best practices become applicable
As I described in the beginning, I started the design phase with research on best practices and novel design/implementation patterns. Pretty standard approach. But this time it felt different.
Previously, when I had to implement an observability layer, I always had to start from an existing product or codebase. That became the toughest set of constraints that ended up dictating the design of the entire layer.
Practical example from Kept: a vendor-neutral trace model, with the vendor confined to the exporter. Try declaring your own plain-data trace the source of truth when you have fifteen services already instrumented with the vendor SDK's decorators; half of them are in Python; and there's a dashboard where three teams filter by attribute names nobody wrote down. You can already feel the headaches building up. But then try it in a fresh codebase: it is one ADR (ADR-0001), one types file (types.ts), a 45-line attribute dictionary (otel-attributes.ts), 111 lines for the exporter (langfuse.ts), and a boundary script (check-eval-boundary.mjs) that fails the build if anyone imports the SDK into core. Easy as pnpm check.
Researching best practices is not very useful when the way your product/codebase is implemented makes it too expensive to adopt them. I realized I didn't have that problem. Having no existing constraints makes the best pattern cheap to adopt.
Benefit #3: you get a first sketch of your architecture for free
So I answered the questions and edge cases from the observability-first angle. I researched best practices and I implemented them in my greenfield tracing layer. I hooked up the self-hosted Langfuse instance and wrote some throwaway scripts to populate the dashboard. Fixed the bugs that came up, too.
All looked good, so I turned my attention to the agent loop. And here's where I got a very pleasant surprise. The loop design was already halfway done:
- the span tree was the loop's control flow. One turn span per invocation, one model-call span per round, one tool span per execution, and the turn's end payload as the return value.
- the end-turn payload makes
outcomerequired, so every exit path had to have one. Enumerating the exits turned the singlereplyoutcome intoreply | failed(reason) | conversation_full, and the failure reasons became the loop's terminal states: max rounds, refusal, max tokens, unknown stop reason, empty reply. The state machine was the trace type, filled in. - the tool span's end payload became the tool contract. Closing a tool span takes
resultStateandresult, so theToolResultcontract adopted those exact names, plus a separateresponsefor the text the model sees.
We all know how hard it is to start with a blank canvas. For me, the first line takes about as much mental effort as the rest of the diagram combined. Where do I start? How do I structure it? How do I avoid a foundation that locks me into the wrong pattern?
The observability-first approach saved me from that trouble and gave me a clear starting point. And by the nature of the exercise, I started with edge cases/bugs first, as opposed to the happy-path approach I'd normally take, which increased my confidence in the foundation even more.
Drawback #1: you'll have to revise the tracing layer later
While asking debugging-oriented questions at the beginning and trying to picture edge cases is an insightful exercise, you won't cover every angle from the start. Naturally, some details will show up only as you're implementing the agent and they will require modifying the tracing layer.
You can argue the tracing layer is more stable when you place it over a codebase that's already live and working, and there's truth to that: you know what the system actually does, instead of trying to picture it upfront. Some of that stability can also come from constraints that make changes expensive. Still, the retrofit can cost less redesign time, and that is a real tradeoff of this approach.
Drawback #2: throwaway scripts
Since you don't have a product in place, you'll need to put some extra work in scripts that simulate real traffic to see what your dashboard will actually look like; and those scripts might not reflect reality as it will present itself in production. You'll end up with code you have to throw away, and if you're not careful, the picture painted by the scripts can be misleading in important ways.
What if I don't have the luxury of working with a fresh codebase?
Initially I wanted to list the "fresh codebase" precondition as a tradeoff, which it is. The approach obviously works best when there's no code and no constraints in place. But I think the insights can be applied to an existing codebase, too. Here are some ideas:
- Go trace-first on every new AI feature. Before writing the feature, write its trace design: which steps become spans, which attributes you will need when it misbehaves, what a crash halfway through should look like. Then write the code to satisfy the trace. The feature boundary is a small greenfield, granted, it needs to be compatible with the system currently in place; and if you find ways to isolate it, all the better!
- Go trace-first after an incident. Same idea from a different angle: instead of starting from a roadmap, prioritize by real pain. Once the immediate problem is mitigated, design the trace that would have made the diagnosis take five minutes, ship that trace, and use it to understand the failure and verify the permanent fix.
- Design the ideal tracing layer as if the codebase didn't exist. Apply the unconstrained research and design step as an exercise. Sketch what one request should look like in the dashboard, ignoring what the code can currently emit, then diff that against what you actually see. You end up with a backlog pre-ordered by debugging value rather than by what is easy. As a bonus, you skip drawback #2 (inaccurate throwaway scripts), since you already have production data to work with.
The obvious caveat here is that Benefit #2 loses its relevance, unless you find a way to fully isolate a new feature from the existing implementation/system.
Conclusion
Observability-first is not a novel idea; observability-driven development has been argued for since the late 2010s. In practice, though, tracing is usually deferred as premature in the rush to ship an MVP and learn from customers. Those practices have earned their place. But with non-deterministic language models sitting at the core of a growing class of products, I'd argue observability deserves to move from afterthought to first step.
How would you iterate on your AI product if you knew what the model did at every step? How would you trust your evals if, instead of judging an output, they looked at the whole picture? How would you respond to incidents? How would you feel about telling your stakeholders "you can trust this product"?
Would it be worth sacrificing fast early progress in favor of some extra time to think about observability?
Discussion